Number of social media network users in South Africa from 2017-2025 (in millions). Source: Statista
This blog post will cover the following key statistics about social media in South Africa. Keep reading to find out more or jump straight to the South Africa social media statistics you’re looking for.
South Africa population & social media demographics
South Africa currently has a population of 58.93 million.
There is a 62% Internet penetration rate in South Africa, meaning there are 36.54 million Internet users, a 3.1% YoY increase.
Of these 22 million are active social media users (37% penetration), a 19% increase compared to 2019.
-
The median age in South Africa is 27.6
-
75% of the South African population is aged 13 and above, 66% is aged 18 and above, and 64% of the population falls in the age bracket of 16-64.
-
51% of the population in South Africa is female and 49% male.
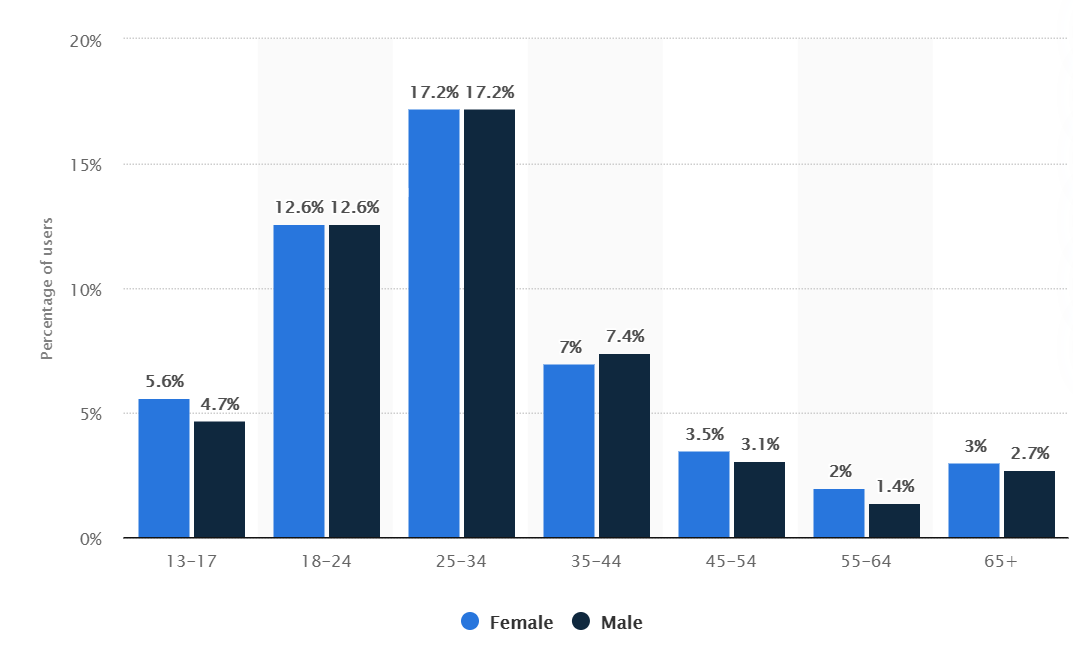
Distribution of social media users in South Africa as of January 2020, by age group and gender. Source: Statista
Let’s see how these statistics stack up against the age and language distributions of social media users which I analyzed using our very own Talkwalker Quick Search.
-
Age distribution on social media in South Africa
As can be seen in the graph below, the age group of 25-34 makes up the largest proportion of social media users in South Africa, at 47.9%. In close second is the 18-24 year old age group, accounting for 40.4% of social media users in South Africa.
Age distribution on social media in South Africa in 2020. Source: Talkwalker Quick Search
-
Language distribution on social media in South Africa
English dominates the online conversation in South Africa at 91.6%. This is followed by Afrikaans, Russian, German, Portugese, French, Spanish, Italian, and Dutch.
Language distribution on social media in South Africa in 2020. Source: Talkwalker Quick Search
General South Africa social media statistics
The average daily time spent on the Internet in South Africa is 9 hours and 22 minutes! Out of these, an average of 3 hours and 10 minutes are spent on social media.
The most used soical media platforms in South Africa. Source: we are social & Hootsuite report
Top hashtags in South Africa in 2020
It's no surprise that #COVID19 tops the list of hashtags used in South Africa in 2020 with over 1.3 million mentions! Not far behind are related hashtags including #LockdownHouseParty, #CoronaVirusSA, #LockdownSA and #Coronavirus,
Top hashtags used in South Africa in 2020. Source: Talkwalker Quick Search
Top social media themes in South Africa
Top two-word themes that came up in social media conversations in South Africa in 2020. Source: Talkwalker Quick Search
Top emojis used in social media conversation in South Africa
Top emojis used in social media conversations in South Africa in 2020. Source: Talkwalker Quick Search
Now, let’s break it down by social media platform in South Africa.
Facebook stats [South Africa]
Number of people in South Africa that Facebook reports can be reached with adverts on Instagram: 20 million
Facebook’s reported advertising reach compared to South African population aged over 13 years old: 45%
Percentage of South Africa Facebook ad audience that is female: 51.3%
Percentage of South Africa Facebook ad audience that is male: 48.7%
Average engagement rate for Facebook page posts of any kind: 3.13%
Average engagement rate for Facebook page video posts: 7.6%
Average engagement rate for Facebook page photo posts: 4.13%
Average engagement rate for Facebook page link posts: 2.18%
Top Facebook posts in South Africa in 2020. Source: Talkwalker Quick Search
Instagram stats [South Africa]
Number of people in South Africa that Instagram reports can be reached with adverts on Instagram: 4 million
Instagram’s reported advertising reach compared to South African population aged over 13 years old: 9.1%
Percentage of South Africa Instagram ad audience that is female: 52.5%
Percentage of South Africa Instagram ad audience that is male: 47.5%
For a list of some of the top Instagram accounts in South Africa, check out this full article.
Twitter stats [South Africa]
Number of people in South Africa that Twitter reports can be reached with adverts on Instagram: 2.28 million
Twitter’s reported advertising reach compared to South African population aged 13 or older: 5.2%
Percentage of South Africa Twitter ad audience that is female: 38.3%
Percentage of South Africa Twitter ad audience that is male: 61.7%
I swear we are fighting two pandemics
Covid 19 and Stupidity
Most engaging tweet in South Africa in 2020. Source: Tallkwalker Quick Search
TikTok Stats [South Africa]
Estimated number of users in South Africa: 6 million
Percentage of brands that have used TikTok: less than 20%
A simple guide to demystify TikTok for brands & influencers
LinkedIn Stats [South Africa]
Number of people in South Africa that LinkedIn reports can be reached with adverts on Instagram: 7.6 million
LinkedIn’s reported advertising reach compared to South African population aged 18 or older: 20%
Percentage of South Africa LinkedIn ad audience that is female: 45.5%
Percentage of South Africa LinkedIn ad audience that is male: 54.5%
Most visited websites in South Africa
Ranking of top visited websites in South Africa by average monthly traffic, according to SimilarWeb.
-
Google.com
-
Facebook.com
-
Youtube.com
-
Google.co.za
Ranking of top visited websites in South Africa by average monthly traffic, according to Alexa.
-
Google.com
-
Youtube.com
-
Google.co.za
-
Facebook.com
-
Netflix.com
If you would like to explore how Talkwalker Quick Search can generate social media inisghts for your brand specifically by analyzing billions of online conversations across the globe, hit the button below and sign up for a free demo!
