Want a better way to measure ROI?
Table of Contents
- How are TV show ratings calculated?
- Why are TV show ratings important to brands?
- How is ROI measured by brands?
- Are TV show ratings still relevant?
How are TV show ratings calculated?
The most commonly known rating system, particularly in the US, is Nielsen. For over 90 years, they have measured what people watch on TV. Their method of collecting this data is to create panels that reflect the traits of larger groups (such as race, gender etc.). These panels’ viewing preferences are tracked and analysed, and the ratings of the whole country or region are then extrapolated from this. In the UK, a similar method is used by the UK’s Broadcasters Audience Research Board to calculate viewership.
Arguably, there are some flaws with this method. Creating panels that are reflective of the population as a whole can only give an indication of how TV shows will be perceived. The results are never going to be accurate; just because someone shares similar traits, does not mean they watch the same TV at the same rate.
There are also some scenarios that can’t be measured. For example, when a group of people get together to watch the match in the pub, it’s almost impossible to know how many people are actually watching. It’s also a lot harder to measure viewing levels of niche TV shows and channels, after all, by definition niche shows are not watched by the masses.
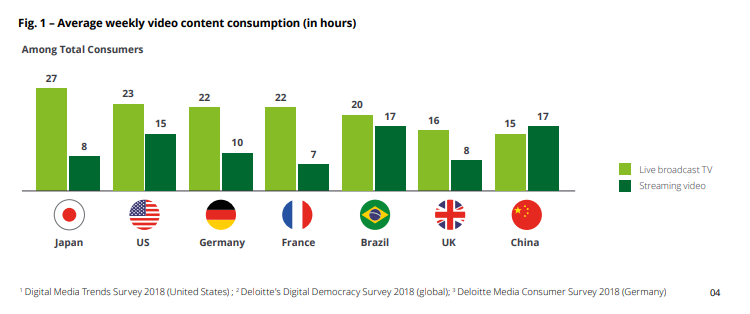
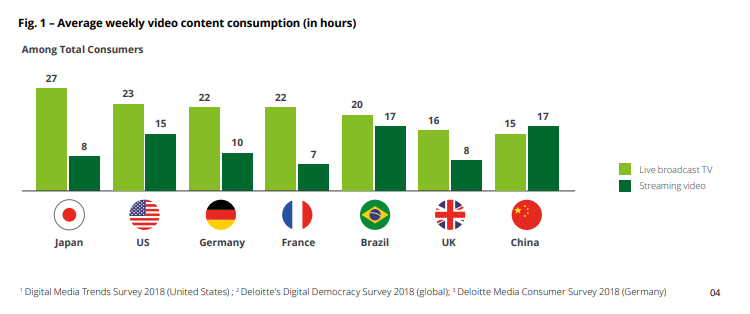
Finally, another factor that adds a challenge to creating consistent TV show ratings is the transparency of data around online streaming platforms. Organisations, such as Nielsen, track views of streamed shows differently to the platforms themselves which can create quite a variation in the overall ratings that are released to the public. This is quite an important factor to consider given the rise in the number of people consuming content this way. According to a recent study by Deloitte into digital media trends, whilst consumers in most major markets still consume more video content via live broadcast TV than streaming, in some countries - such as Brazil - streaming is catching up quickly. In China, streaming has already overtaken live broadcast TV as the main source of video content.
This just goes to show that there are a number of different ways to calculate TV show ratings. As more streaming and online platforms begin to track and share their own ratings, it’s likely to become harder for brands to rely on one set of data to make decisions around ad spend and sponsorship.
Discover what people really think about your brand
Why are TV show ratings important to brands?
There are a few ways that TV ratings are used. Aside from TV networks using them to decide which shows to recommission and invest in, brands have traditionally tracked them to determine their ad spend.
TV shows that have high ratings, are going to attract more interest from brands. The cost of airtime during the ad break is likely to be much higher, but given that more people are likely to see the ad, the ROI is also likely to be greater.
In the US, the Super Bowl is the prime TV event for advertising, frequently drawing in an average of over 100 million TV viewers each time. In 2020, the game averaged 102.1 million viewers - the 10th most watched Super Bowl and the 11th most watched TV show ever. Overall, a total of 148.5 million people watched at least part of the game.
Advertising during the Super Bowl comes with a high price tag though. To air a 30-second ad at the 2020 game cost 5.6 million USD. This is largely because the commercial break is considered by many viewers (79%) as part of the entertainment. So much so, that many actively seek out the Super Bowl commercials on-demand after the game; during the 2019 Super Bowl, consumers spent 641 thousand hours watching Super Bowl ads on YouTube. The effects of TV advertising also go beyond viewership, with millions of mentions of the commercials happening on social media. This all helps to boost ROI, and goes some way in explaining the ever-increasing price tag.
Another area for which TV show ratings are important is sponsorship. This goes beyond ad spend for brands, as it means committing to spend money on a particular TV show or series for a long period of time. However, according to research by Thinkbox commissioned research in the UK in 2017, this strategy can pay off. TV sponsorships drive long-term brand health and awareness with viewers at a time when digital advertising often leans on short-term gain. The research showed that while ad awareness in the six months following the end of the sponsorship fell at the expected rate, other brand health metrics decayed at a much slower rate. The benefits of TV sponsorship are particularly clear for lesser-known brands.
When it comes to determining which TV shows a brand should sponsor, TV show ratings certainly play a part, along with the content of the show. Not only should the show align with the brand message and core product, but it also has to have the numbers of viewers to make the investment worthwhile, along with the right demographic.
A great example of this in the UK is the recent sponsorship of Ant and Dec’s Saturday Night Takeaway by Deliveroo. Not only did the show’s concept align with Deliveroo’s product - the name of the TV show alone fits perfectly with Deliveroo as a food delivery service - but it also had incredibly high ratings. Saturday Night Takeaway has consistently drawn in large audiences. When the first episode of the new series aired on 21 March, it took the top spot of viewing numbers for that weekend with an average of 9.5 million people watching, and a peak of 11.1 million. This not only broke the show’s own record for viewership, but it also became the largest overnight draw on any channel in 2020 to date.
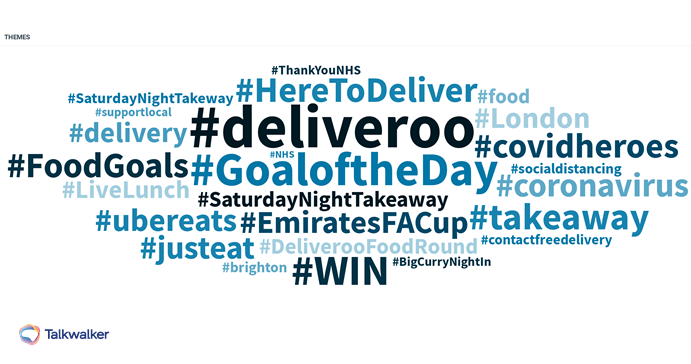
We can see that association of the brand with the TV show has clearly stuck. #SaturdayNightTakeaway is one of the main hashtags used alongside mentions of Deliveroo in the last 6 months.
Theme cloud from Talkwalker Quick Search shows the hashtags associated with Deliveroo, including 'Saturday Night Takeaway'
Another example of successful TV sponsorship campaigns is UK mobile telephone network giffgaff. Their sponsorship of US sitcom, The Big Bang Theory, on UK channel E4 back in 2012 really helped to raise the profile of the brand. This was capitalised on by the brand who created an interactive element - a form of social TV. Each of the idents used before, during and after the programme showed different objects being blown up, and each time the audience was invited to vote on what should be blown up next. By involving the audience in this sort of decision making, they became invested in the sponsored idents (and, by association, the brand), becoming active fans, rather than passive observers.
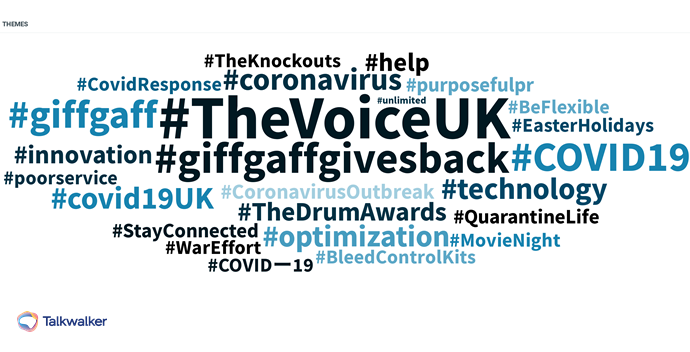
They have since taken this idea of social TV - i.e., continuing the conversation around a TV show onto social media - further with their sponsorship of The Voice UK. In each of the ad breaks, they would share viewers’ tweets about the show. Again, this was a great way to get viewers engaged with the campaign, and therefore giffgaff.
Theme cloud from Talkwalker Quick Search shows the hashtags associated with giffgaff, including 'The Voice UK'
Whilst giffgaff’s social approach contributed greatly to increased brand awareness, it was also thanks to the ratings of the TV shows they sponsored that helped them to get the visibility they needed within the demographic they wanted to target. According to DigitalSpy, episodes of series 6, which aired on E4 in 2012 - the year of giffgaff’s sponsorship - saw viewing figures of over 1 million. And the final of the Voice UK in 2019 saw average viewership at 4.6 million, with a peak audience of 5.2 million. It’s for these reasons that brands look to TV show ratings to determine their sponsorship strategy.
Track how your brand is being talked about
How is ROI measured by brands?
According to David Figueroa, Growth Strategist & CEO at Catch 5 Direct, to measure ROI on traditional TV advertising (i.e. cable, broadcast, syndication, and satellite), most brands will use a combination of techniques. Marketing Mix Modelling (MMM) is often used to provide information around the effectiveness of a particular TV campaign on driving sales volume, or the incremental contribution of any channel on the entire marketing mix. This is usually combined with TV spot attribution to get more granular insights, e.g., which networks, programming, creative, dayparts, etc., are generating a high amount of interest in the brand.
Another way of measuring ROI is around brand awareness based on brand recall at any given period of time. The aim of TV advertising and sponsorship is rarely to lead to direct sales - you don’t expect people to immediately go out to your store and purchase a product after seeing an advert. Instead, it’s about increasing brand awareness, so that when someone is ready to purchase the product or service you offer, your brand will be front of mind.
Are TV show ratings still relevant?
The rise of online streaming platforms such as Netflix and Amazon Prime that also create their own content has led to a decline in viewership on traditional TV. The way people view traditional TV has also changed, with each channel now offering their own on-demand streaming services, often with fewer adverts. As mentioned earlier, this data is tracked differently by each platform, which makes it harder to come up with consistent TV ratings. Which should brands trust to make decisions on their marketing budgets?
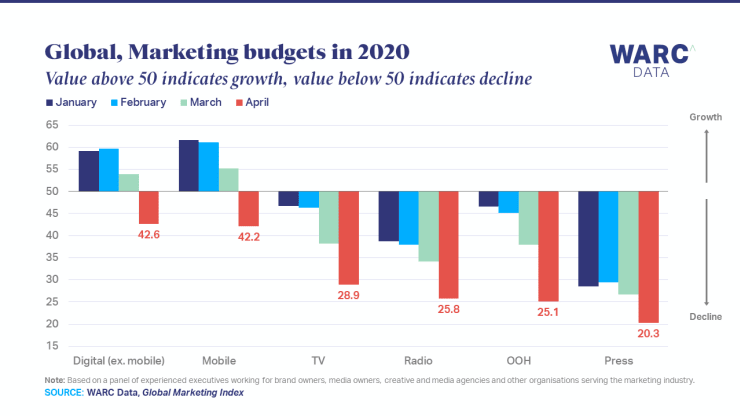
With a smaller audience to access and a lack of transparency around TV show ratings, brands are already shifting their ad spends from TV advertising to online. This can generally be more easily tracked and measured than TV, enabling brands to more clearly see ROI on a particular ad campaign. It also helps them to determine where money should be spent in future. This is a trend that started a while ago, but has appeared to accelerate during the pandemic.
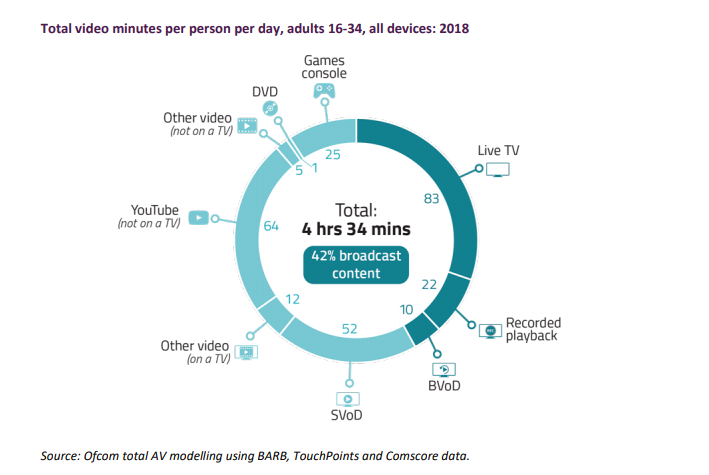
In addition to online streaming platforms, more and more people watch video content on social channels such as YouTube. A recent Ofcom survey revealed that YouTube viewing by all UK adults has increased by 6 minutes a day since 2017. Of the total 4.5 hours of video content watched each day by 16-34 year-olds, YouTube comes in as the second largest channel after live TV.
The type of content found on these channels and the demographics that watch them is completely different to that found on traditional TV. Social platforms such as YouTube also enable brands to do much more targeted marketing, as the content tends to be more niche and the data (such as engagement etc.) is easier to track. If done correctly, brands stand to achieve a much higher ROI than with traditional TV advertising thus contributing towards the shift from TV to digital advertising.
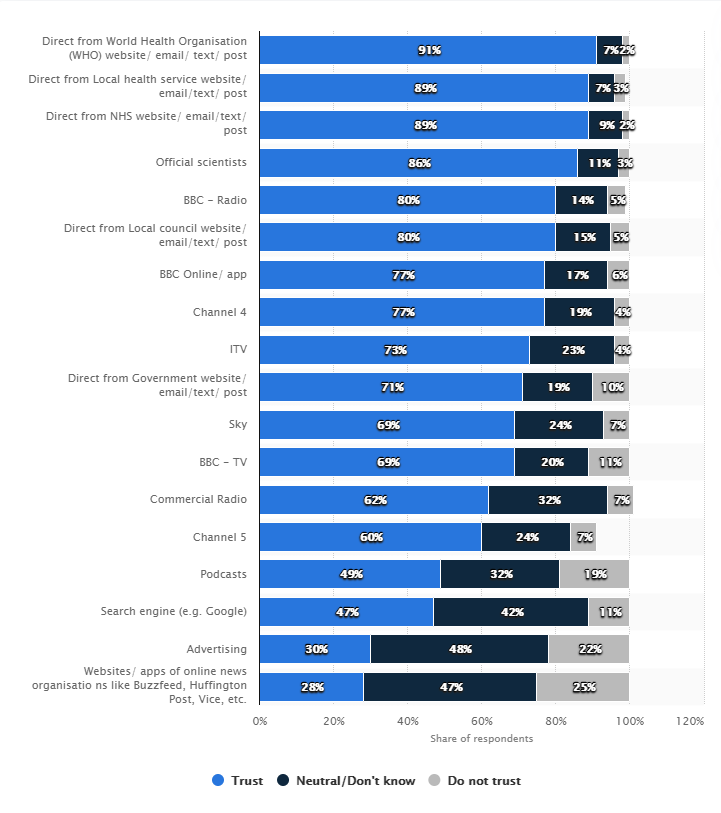
Despite all this, TV is still an important advertising channel for brands, and whilst marketing spend was reduced during the pandemic, TV has played a more central role in people’s lives. For many people who were alone and not working during the weeks of lockdown, live broadcast TV scheduling provided an element of structure that was otherwise lost. In the UK, there was also a feeling that traditional TV as a source of news was more trustworthy in times of uncertainty and danger in contrast to a lot of the fake news that is shared on social media.
How different sources of news were considered trustworthy during the pandemic
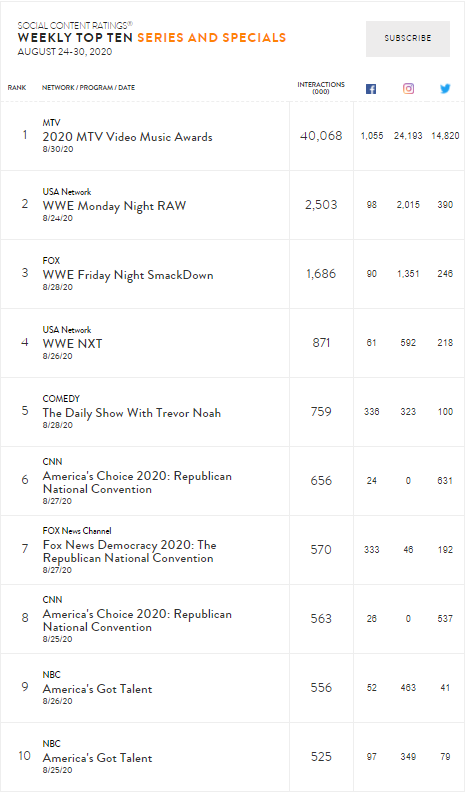
It remains to be seen whether this renewed love of TV will last in the long term - there are already signs that the ratings spikes at the beginning of the pandemic are beginning to flatten. If it does continue, however, TV show ratings may become more relevant to brands again. Where we are likely to see a shift towards though, is tracking social TV. This means tracking engagement and conversations happening on social media channels about particular TV shows - something Nielsen Social is already doing.
Nielsen Social compiles social content ratings weekly top 10 lists
By tracking this alongside traditional TV show ratings, brands not only learn which shows are being watched most, but also what people really think of them. Brands can also get a more accurate picture of the audience demographic, as tracking social conversations is not limited to a focus group, allowing for more targeted advertising across more channels. In addition, it opens up a channel for brands to communicate with their target audience and can help to plan content for social strategies, ultimately offering even more return on the original investment.

