Annual reporting?
No sweat!
Kiran, from our data storytelling team, has built you a simulated end of year marketing report template, to help and inspire you. My guide includes EOY social media reporting tips and tricks, to ensure your report...
- Presents all your results comprehensively, in one place
- Finds data from multiple marketing channels
- Demonstrates the role and performance of your marketing team
Simulated end of year marketing report template.
As a marketer, part of my role is doing weekly and monthly marketing reports. Everyone in our team measures performance and results.
Why? So we can understand which campaigns are working. What marketing channels are performing. Whether our email marketing is bringing results. And… what’s failing.
It takes time, sure, but it’s worth it...
- One of our blog posts is ranking on page one in Google, and one is languishing on page five… Why?
- Our latest customer case study has a ton of traffic, but isn’t converting… Why?
- Tweets for our latest social media marketing campaign aren’t engaging… Why?
- The unsubscribe rate for our newsletter is increasing… Why?
You’ll learn what’s working and what isn’t. You can optimize, outreach, and improve.
Your end of year marketing report design is the culmination of your team’s marketing efforts. It summarizes your successes and failures. These insights will have an impact on next year’s strategy and budget.
Let’s go deeper…
Table of contents
- What's an end of year marketing report?
- Why you need an annual marketing report
- What to include in your EOY report
- Presenting your year end report
- Tips for creating your end of year marketing report
- Your free EOY marketing report template
What’s an end of year marketing report?
Your EOY or annual report to be filed should include data and performance insights from all the marketing channels you use to promote your brand, products, and services. Showing whether you're going in the right direction, or if you need to make improvements.
It’ll prove if you’re meeting your goals and KPIs. Which social media campaigns worked, and which tanked. Financial reporting will show where your marketing budget is being spent, and go towards proving whether you’ll need a bigger budget in the new year.
It’s your roadmap, highlighting your priorities, initiatives from the year that should be dropped, and your short/long-term expectations.
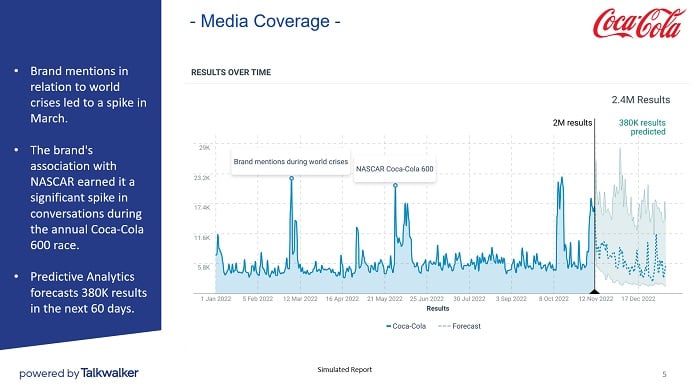
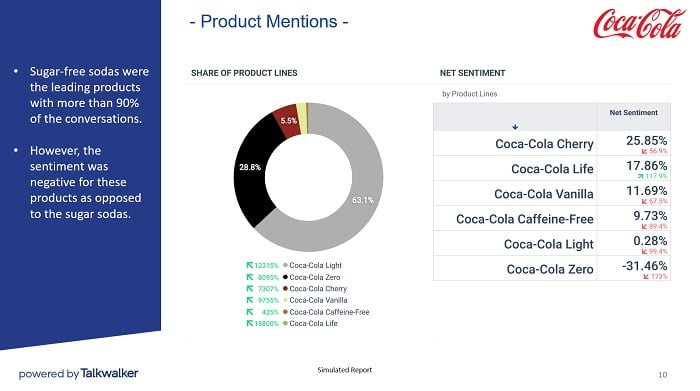
Mentions spiked in relation to world crises in March. The brand's association with NASCAR caused a spike during the annual Coca-Cola 600 race in May.
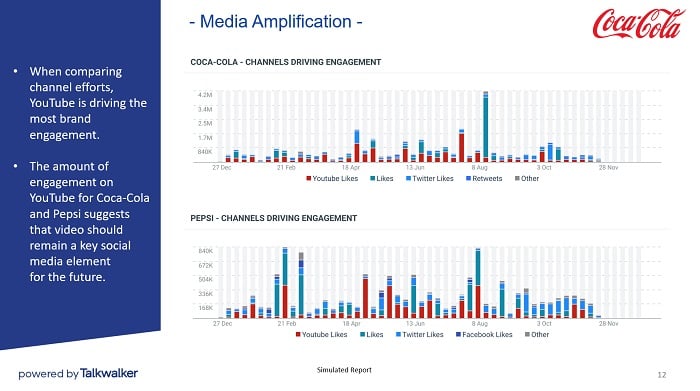
Predictive Analytics forecasts 380K results over the next 60 days.
Your year end marketing report should include…
- Your marketing strategy - goals and projected outcomes
- Audience and market research
- Promotions and events
- Paid social media advertising
- Email campaigns
- Goals
- Expected outcomes
Why you need an annual marketing report
The benefits of an end of year report are substantial.
As I said, we do reporting throughout the year, whether it’s weekly, monthly, quarterly, or for individual campaigns. If we don’t measure our ongoing results, track metrics and goals, we could - we will - waste time and money. And, we’ll never improve.
Your annual marketing report is the most important report of the year. It gives you a 360° view of your performance, and it provides a data-driven resource for your team and company.
EOY reporting can...
- Showcase your marketing wins
- Provide performance statistics to benchmark against
- Identify which marketing channels work best for your brand
- Review and update your key performance indicators - KPIs
- Justify your marketing spend, while seeking approval for a bigger budget
- Find underfunded parts of your marketing strategy
- Provide actionable insights for next year’s strategy
- Provide gap analysis to show what’s missing from your marketing strategy
Overall, the report shows how your team has been working toward reaching - and hopefully crushing - its goals. Meanwhile, it can also reveal issues that may need closer attention in the coming year.
We’re all pushed for time. When presenting your end of year marketing report to your team, boss, company, stakeholders, ensure it’s an easy read.
It must be engaging and accessible. A visual presentation. Take a look at our simulated marketing report, and see the best way to present your results.
I Need My Free EOY Marketing Report Template
Okay, let’s get started on your annual marketing report…
What to include in your EOY report
What you include in your end of year marketing report, will depend on who you’re presenting your report to - your team, c-level, stakeholders, partners, etc.
As a team, to understand how effective your marketing strategy is, it’s good to monitor low-level metrics - bounce rate, engagement, number of mentions - and to a lesser extent, vanity metrics like follower growth. But, top management doesn't need those figures. They want the results...
- How did your engagement increase conversion rate?
- What does this mean for the company’s return on investment?
Your results should lead to your company’s bottom line. For an effective EOY marketing report, tie your social metrics to revenue. Compare key business impact metrics to social results, and demonstrate how your social media campaigns directly impacted your brand.
While the focus may be different, depending on your industry, key elements will figure in your end of year reporting…
Marketing goals and strategy
First up should be your marketing strategy and goals. A concise description of your company’s direction and how you’re going to meet your goals.
Concentrate on your yearly marketing goal…
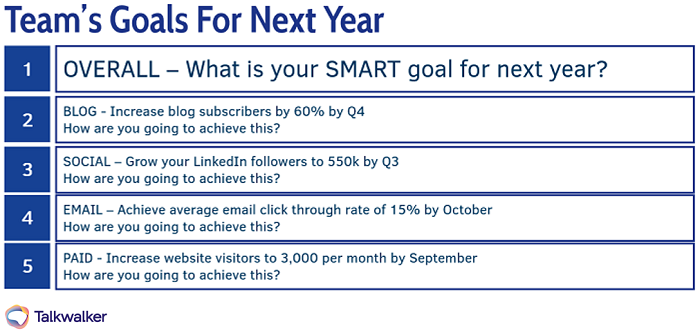
Establish your strategic goals for the following year.
Key to setting achievable marketing goals is to understand your current position. To move forward, you must look backwards.
KPIs
This is where you highlight your year's marketing targets, along with the results generated.
Check out some of the factors that your boss will want to see results for...
- Audience demographics
How are you performing with targeted segments of consumers? Are your competitors focusing on a segment that you're ignoring? Audience demographics KPIs to include - age, gender, location, device. - Website performance
Knowing what you want to achieve helps you establish your strategy for success. Website performance KPIs to include - visitors, sessions, new vs returning visitors, conversions, bounce rate, page load time. - Channel performance
Which of your channels is performing best. Which one is bringing the money? Which one is falling behind? Channel performance KPIs to include - best acquisition channels, cost per acquisition - CPA, budget attainment, return on marketing investment - ROMI.
Marketing channels
Which channels - email, SEO, social media - are growing and bringing the best results? Are there ones that need to be improved? Use a consumer intelligence platform and Google Analytics to analyze performance on your content marketing channels.
Website performance
Google Analytics will provide performance results for your website - sessions, conversions, bounce rate, time spent on site, customer journey.
In your annual reporting, include any changes you made to your site - content updates, new pages, new navigation, SEO, along with the results of this optimization.
Paid advertising
Include your paid campaigns for the year, along with results.
Is your paid strategy working? Did lead generation improve on last year’s? How much are you spending? What’s your ROI?
Each platform has inbuilt analytics - Facebook Ads, LinkedIn Ads, Twitter, Google Ads - but you can also use Talkwalker’s Paid Social feature.
Year-over-year performance
Compare your KPIs with previous years, to show where your marketing has improved over time, and where it needs work.
Next year’s plan
Your end of year marketing report is going to be a working document. One that not only shows the current picture, but also demonstrates what’s going to happen next year.
Being brutally honest is a must. Highlight your hits, but also your weaknesses. This will drive next year’s plan of improvements.
Takeaway
Insights into actions…
Take all you’ve learned from your report, and turn it into action points for next year.
Include a summary that showcases insights, alongside recommendations for improvements to next year’s marketing campaigns.
You must also look at what didn’t work, and plan how to avoid such issues in the future. Proactively tackle the pain points your brand faces. Also, consider the issues facing your industry as a whole, so you can shape next year’s digital marketing plan effectively.
The secret of a great end of year marketing report isn’t to show how effective your plan was. But to show that you can repeat it and improve it, again and again and again...
Who’s reading your EOY report?
What do they consider important? Brand mentions? Headline mentions?
Presenting your year end report
If you want your annual report to be comprehensive, how you present it is important.
Use our simulated marketing report template as inspiration.
Include data visualizations so viewers can understand and remember. Actionable insights clearly explained.
Be ready to answer questions. Lots of questions.
And, performance benchmarks that’ll demonstrate your growth.
Data visualizations
13 milliseconds for our brains to process an image. That’s 60,000 times faster than processing text.
Our brains understand images. We remember them. Data visualization translates complicated datasets into a clear and concise message. Tables, graphs, charts - whatever it takes to make your report comprehensive.
But, that graph you’ve included, demonstrating great results, or valuable peaks of engagement, might not be so clear to someone that hasn’t worked with social media data. They might not have a clue what the image represents.
Check out What is image analysis?, for more on humans deciphering pictures.
Highlight what your audience should focus on. Include insights in comments to explain what the graph is showing.
Data visualizations and written insights translate complex information so your audience understands and remembers your results.
Actionable insights
You’ve presented your graph and highlighted a spike in mentions. Great. Ready for the next question?
Why?
When writing your annual report, and highlighting spikes, dips, etc., you have to be ready to explain why something happened....
- What caused that one blog post in July to get a higher than average engagement rate?
- Why did you see an increase in traffic to a specific landing page?
- How did you increase organic traffic in Q2?
- Why didn’t your Q3 social media advertising campaign fail to meet your goals?
- What didn’t work in your paid ads that meant you had to rework?
These are the kind of questions you’ll be asked, and have to be able to answer. Why? Because your boss will expect you to be able to replicate your successes and avoid repeating your failures.
Avoid including too much unexplained data in your report. Instead, provide data-driven insights that show why certain things happened. Be prepared to answer questions. It’ll show your boss that when it works, it works big.
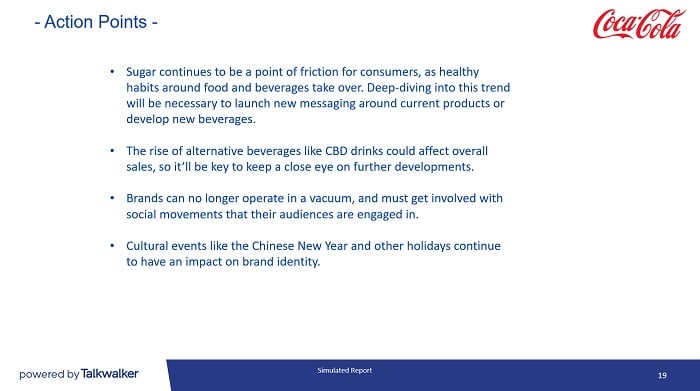
Including action points in your end of year marketing report, ensures that the analysis brings value to next year’s marketing strategy.
I'll Take My Free Marketing Report Template Now!
Performance benchmarks
Results don’t mean much when considered on their own.
4,000 free trial requests in Q3. And? Is that good or bad?. If your average was 2,000 in Q1 and Q2, now it sounds a whole lot more impressive.
Giving average figures - benchmarks - and year-on-year analysis, it’s easier for readers to see the trends coming from your campaigns. Whether you’re growing month on month or quarter on quarter.
Don’t forget competitor analysis...
Find out if your blog posts are more popular than your competitors. Whose Twitter strategy is more effective? Are your competitors targeting an audience segment that you’re missing?
Those 4,000 free trials sound way more impressive if you can prove that your biggest competitor only brings in 500.
Monitor your brand’s social media and compare with you competitors.
Identify where they’re performing better, and how you can improve.
Tips for creating your end of year marketing report
This guide and our marketing reporting template will help you create an annual report of your marketing performance. How it compares to last year, and the goals you should set for next year.
To help you report your end of year results, here are some tips to start you on your journey…
Be consistent
It's important to be consistent across all your reporting - weekly, monthly, quarterly, yearly. Align your metrics and filters, otherwise you're comparing apples with oranges.
Vanity metrics are just that
It’s great having a ton of followers, but so what if they’re not turning into customers. Your annual digital marketing reporting should represent your overall reporting.
Vanity metrics give a skewed view. Rose-tinted spectacles, if you will. Reporting your marketing activities must show your high points and your low points. This level of honesty will allow you to understand what’s working and can be replicated, and what’s failing and should be optimized or scrapped.
Data to insights to action
Your annual performance report needs to be more than pages and pages of numbers. While they’re important, what they mean and what you can do with them should be your goal.
Analyze the data to find insights - buying behavior, consumer sentiment, competitor intelligence, etc. - that will drive your actions towards an optimized online performance.
Illustrate your results
The human brain processes images 60,000 times faster than text. Including data visualizations in your marketing reporting will help communicate your results so that they’re understood across the board. From a bar chart to a multidimensional data map, data viz will show trends, patterns, brand performance, brand impact, and more.
Marketing dashboards & templates
Use our simulated annual marketing report template as a starting point!
Your free EOY marketing report template
Stop putting it off.
For an end-of-year marketing report with maximum impact, keep it concise, visually appealing, and easy to digest.
I know, you keep finding something more important to work on, but it has to be done. Start working on your annual marketing report now. Even if you haven’t got all your previous year’s data, you can decide which visuals to include, and gather those vital early-year insights.
Don’t forget to download your simulated report...

